
U.S. Paper Packaging Sourcing in 2026
Trade, Manufacturing, Price, Recycling & Regulation for Packaging Buyers
Executive Summary
Paper packaging is often discussed as if it were one market moving in one direction. The evidence assembled for this report does not support that shortcut. Different customs classifications, domestic manufacturing industries, product categories, producer-price series, recycling methodologies and regulatory provisions answer different questions. A sourcing decision becomes more defensible when the buyer first identifies the physical structure, use case, material system, trade classification, environmental claim and destination market, and only then selects the evidence that fits that decision.
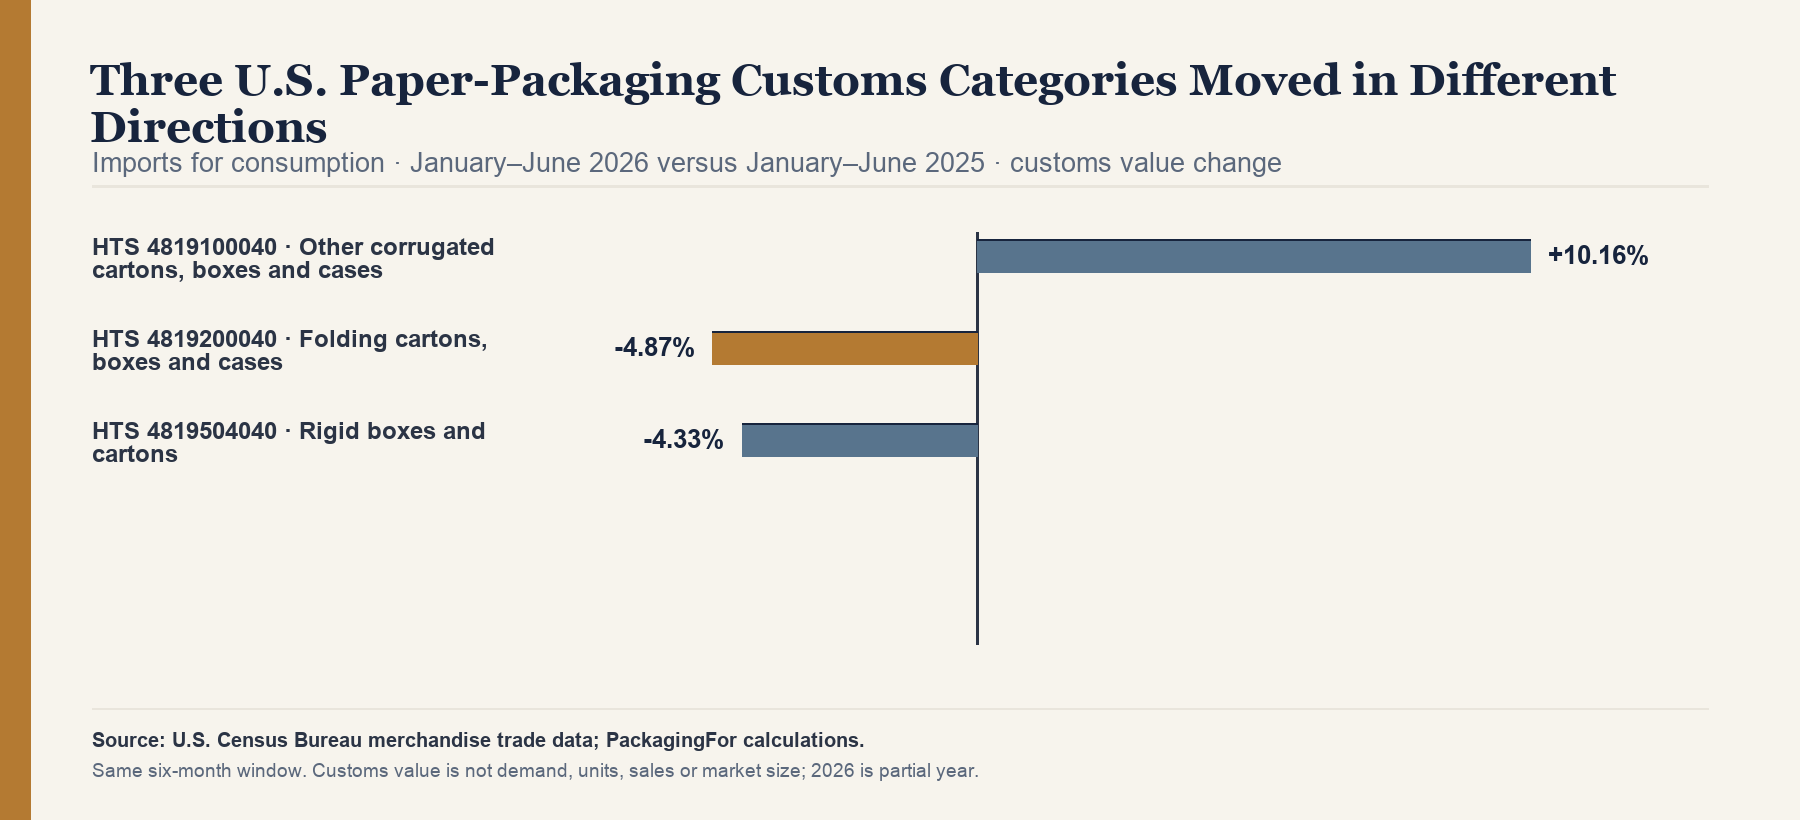
The first finding is that like-for-like U.S. customs values diverged across three validated paper-packaging classifications in the first half of 2026. Compared with the same months of 2025, HTS 4819100040 increased 10.16%, HTS 4819200040 decreased 4.87%, and HTS 4819504040 decreased 4.33%. These are customs-value movements for the exact disclosed categories, not changes in sales, consumption, unit volume or a custom-packaging market. The first category covers other corrugated cartons, boxes and cases; the second covers folding cartons, boxes and cases of noncorrugated paper or paperboard; the third covers U.S. imports classified as rigid boxes and cartons. None can be silently renamed as a narrower commercial product. [1]
The second finding concerns origin concentration inside the validated rigid-box customs category. In 2025, China represented 49.83% and Vietnam 23.41% of U.S. customs value for HTS 4819504040. Together they represented 73.24%, while the five largest origins represented 86.64%. This is concentration by country of origin and customs value. It is not supplier concentration, manufacturing capacity, quality performance, geopolitical exposure or a share of a luxury or custom rigid-box market. It does, however, show why an origin plan for this category deserves explicit attention rather than being inferred from the origin pattern of corrugated or folding-carton classifications. [2]
The third finding is that U.S. manufacturing evidence must also be read at the right classification level. The 2022 Economic Census reported $18.563 billion for “Manufacturing of folding paperboard boxes, packaging, and packaging components” and $769.845 million for “Manufacturing of setup paperboard boxes, packaging, and packaging components.” These are exact NAPCS product measures reported across establishments, not estimates of total addressable market, domestic demand, capacity or custom-only sales. They demonstrate that official product statistics can distinguish folding and setup structures even when broader NAICS industry statistics answer a different question. [3]
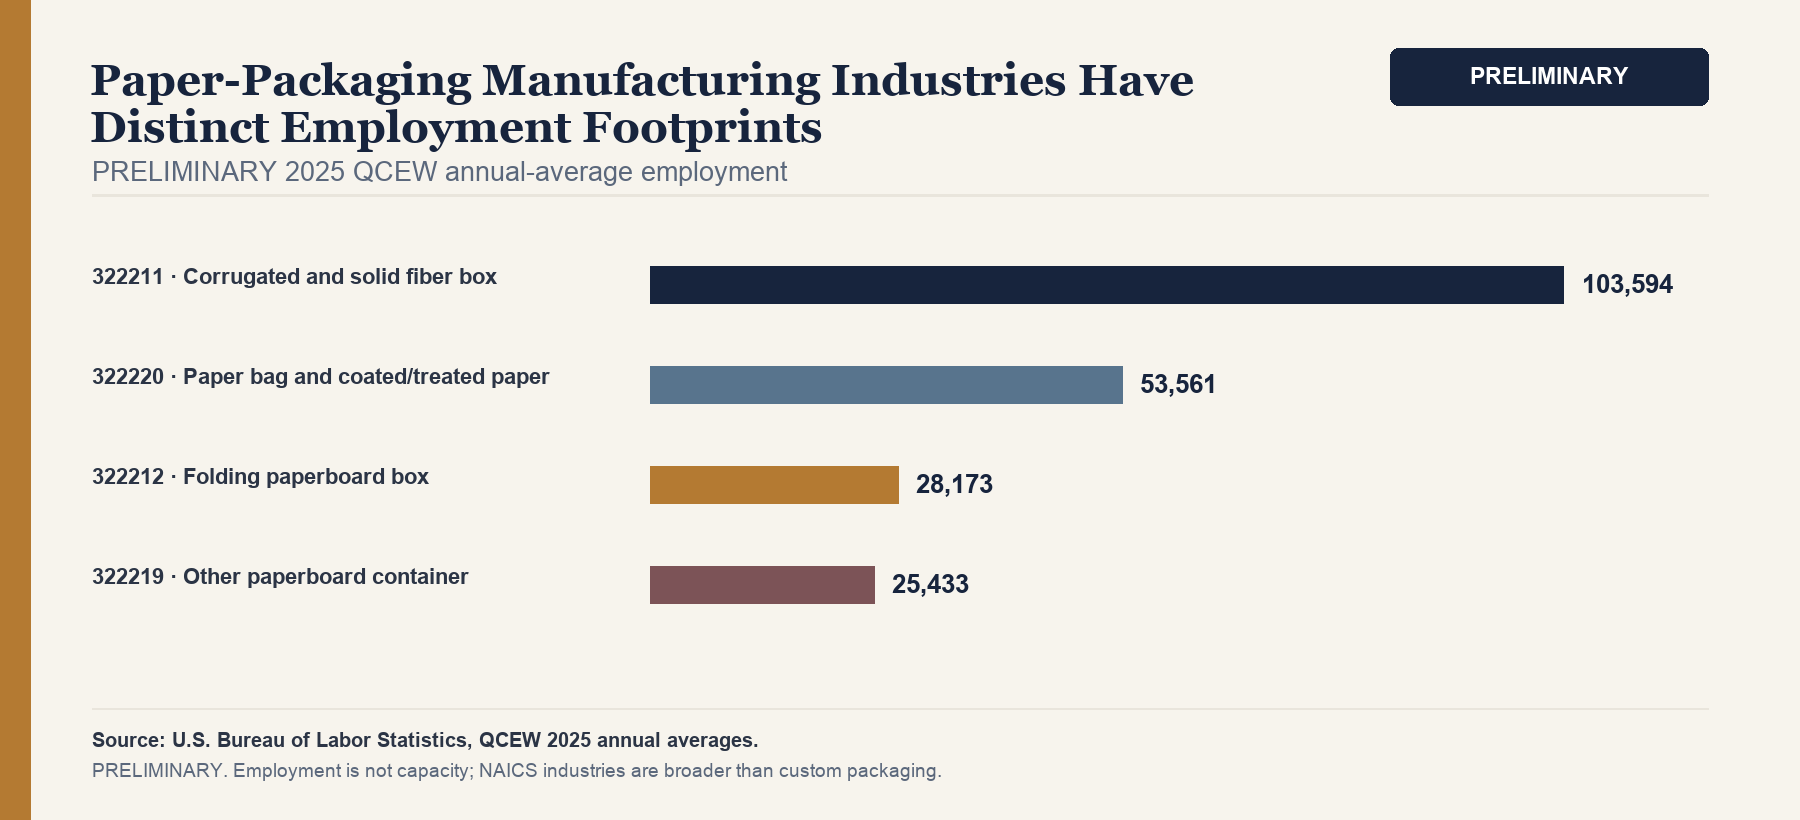
The fourth finding is that domestic manufacturing footprints vary by industry definition. PRELIMINARY 2025 QCEW annual-average employment was 103,594 in NAICS 322211, 28,173 in 322212, 25,433 in 322219 and 53,561 in 322220. Those codes respectively cover corrugated and solid fiber box manufacturing, folding paperboard box manufacturing, other paperboard container manufacturing, and paper bag and coated and treated paper manufacturing. Employment is a labor-footprint indicator. It does not measure capacity, output, factory count, lead time or a supplier’s ability to make a particular package. Every 2025 QCEW value in this report remains preliminary. [4]
The fifth finding is that official producer-price signals also diverged. Average PPI changes for January–July 2026 versus the same 2025 months were +3.91% for corrugated and solid fiber box manufacturing, −4.01% for folding paperboard box manufacturing, +5.61% for other paperboard container manufacturing, +6.22% for paper bag and coated and treated paper manufacturing, and +6.86% for the setup (rigid) paperboard boxes subseries. PPI measures index movement at the producer level; it is not a unit box price, supplier quote, margin, landed cost or forecast. Recent index values may be revised. [5]
The sixth finding is that packaging extended producer responsibility in the United States is state-specific, not one national rule. California, Oregon, Maine, Colorado and Minnesota have different statutes, timelines, scope tests, assigned roles and implementation status as of the evidence cutoff. A package or company cannot be labeled “EPR compliant” in the abstract. The relevant questions include where the packaged product is sold or distributed, who is the covered producer under that state’s law, which packaging components are in scope, and which exemptions, reporting duties, fees or plan requirements apply. This report provides general information, not legal advice. [6]
The seventh finding is that the European Union Packaging and Packaging Waste Regulation has a general chronology but provision-specific obligations. Regulation (EU) 2025/40 entered into force on February 11, 2025 and generally applies from August 12, 2026. Article-specific and later staged dates still require separate review. The evidence in this report also distinguishes plastic-specific recycled-content provisions from broader minimization and documentation questions, and preserves the stated cardboard-box exclusion within the relevant reuse provision. No supplier statement can replace a product-, material-, actor- and market-specific applicability review. [7]
Taken together, the evidence supports a category-by-category procurement frame. Trade direction does not reveal demand; origin concentration does not reveal supplier quality; employment does not reveal capacity; PPI does not reveal a quote; recycling rates do not establish the performance of a specific package; and a regulation’s general application date does not make every provision uniform. The practical response is to connect each decision to the right evidence and to build a transaction-specific record covering classification, specifications, origin, material composition, substantiation for claims and jurisdiction-specific documents. That framework narrows uncertainty without pretending that public statistics can choose a supplier or guarantee compliance.
01 — How to Read This Report
This report is organized around measurement boundaries. The trade layer uses exact ten-digit Harmonized Tariff Schedule classifications. A1 is HTS 4819100040, “other” corrugated cartons, boxes and cases. A2 is HTS 4819200040, folding cartons, boxes and cases of noncorrugated paper or paperboard. A3 is HTS 4819504040, rigid boxes and cartons. A4 is a disclosed technical basket of two paper sack and bag classifications used only for context. These descriptions are classification labels, not a catalog of every commercial design inside each code. A corrugated mailer may sit within a broader corrugated category, but the category itself cannot be reported as “mailer-box imports.” The same rule prevents A2 from becoming “cosmetic-box imports” and A3 from becoming “luxury rigid-box imports.”
The domestic layer uses two classification systems. NAICS groups establishments by their primary industry and is suitable for employment, establishment and broad industry context. NAPCS classifies products and is suitable for exact product measures such as folding paperboard box packaging or setup paperboard boxes. A NAICS establishment may report more than one product, and a NAPCS product may be reported by establishments assigned to more than one industry. The systems are complementary, not interchangeable. Neither produces a count of PackagingFor-like suppliers or a measure of custom-box capacity.
The price layer uses BLS producer price indexes. An index shows relative movement from its base, not a currency price per package. The trade layer also includes declared customs value divided by reported shipping weight for comparable air-and-vessel general-import records. That ratio is a category-level value-to-weight indicator, not a price per box, a freight rate or landed cost. Supplier quotes and buyer-specific cost models belong to the transaction layer, where dimensions, board, print, finish, tooling, quantity, packing, incoterms, duties, freight, inventory and rework can be aligned.
The sustainability layer separates technical recyclability, local acceptance, collection or recovery, actual recycling, a reported recycling rate and mill use. A percentage is meaningful only with its publisher, reference year, material scope, numerator, denominator and method. The regulatory layer reports status at the August 21, 2026 cutoff. It is general information, not legal advice; scope depends on the product, material, role, jurisdiction and transaction.
Four labels guide interpretation. FACT is a direct source observation. CALCULATION is reproducible arithmetic performed on cited observations. INFERENCE is a bounded conclusion drawn across sources. RECOMMENDATION is an action proposed for buyers, not a measured outcome. Claim grades indicate publication readiness: A-grade claims have the strongest direct fit; B-grade claims are usable with visible limitations; C-grade claims are context only; D-grade claims are disclosed implications. Every material statement is mapped to internal Claim and Evidence IDs so the manuscript can be audited before publication.
02 — Paper Packaging Does Not Move as One Market
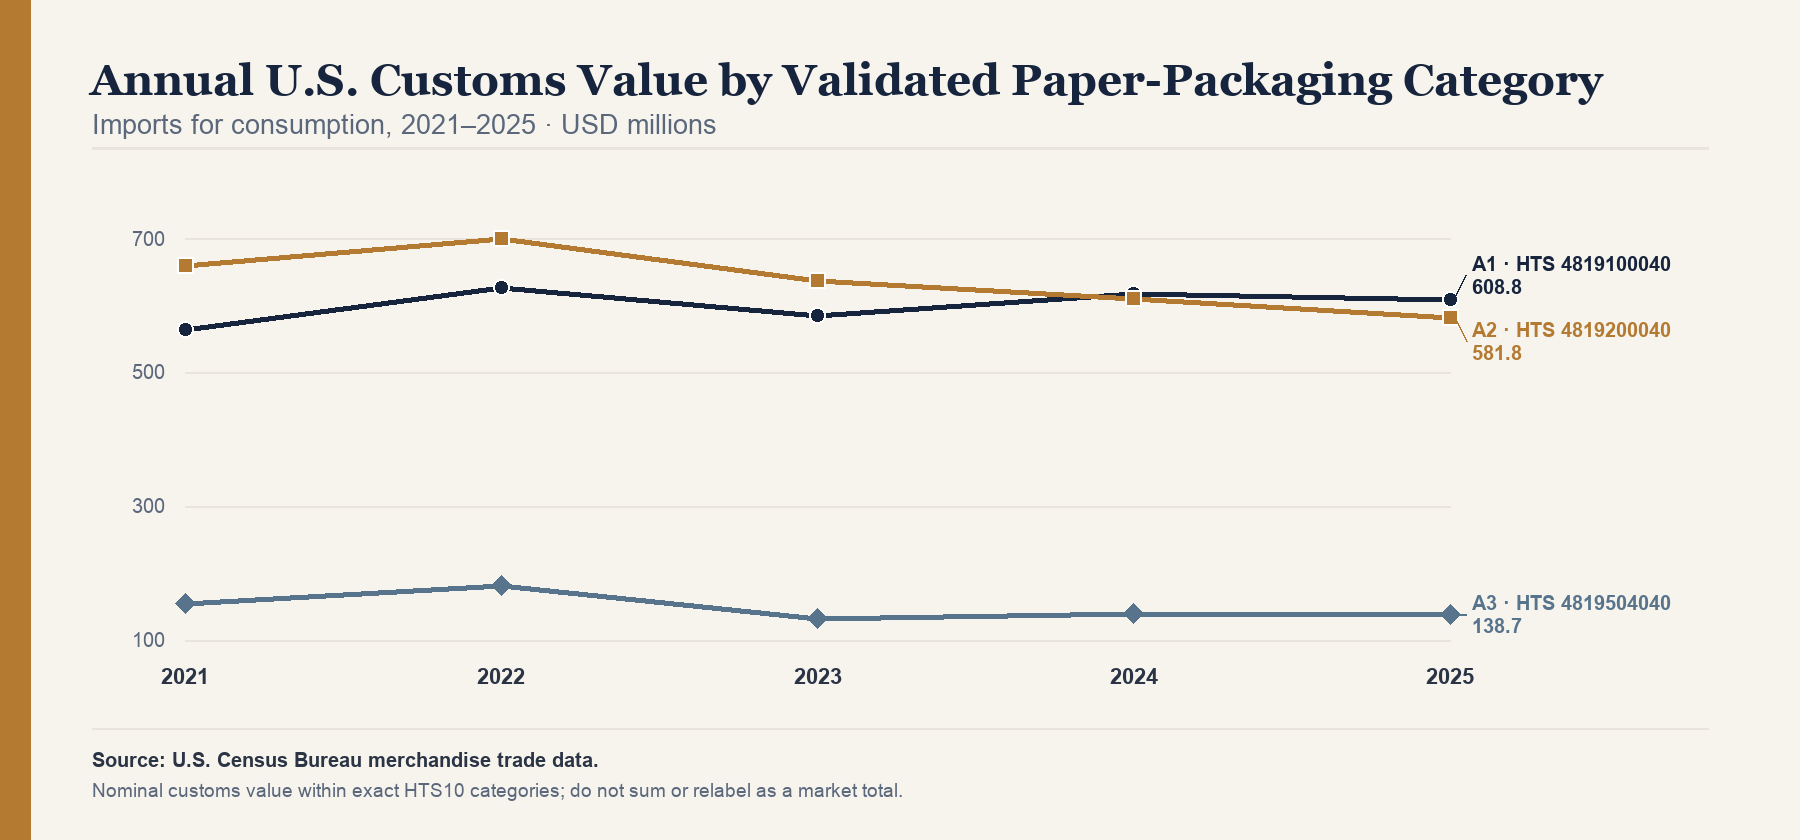
The clearest trade lesson is divergence, not a single headline. Full-year U.S. imports for consumption in A1 were $563.7 million in 2021, $627.7 million in 2022, $585.8 million in 2023, $618.7 million in 2024 and $608.8 million in 2025. A2 recorded $660.7 million, $700.5 million, $638.1 million, $610.9 million and $581.8 million across the same years. A3 recorded $153.9 million, $180.9 million, $132.6 million, $139.2 million and $138.7 million. These series describe customs value within stable disclosed codes. They do not represent combined market size, and they should not be added to domestic product statistics because customs values and manufacturing product measures use different universes and concepts. [8]
The first-half comparison reinforces that categories did not move together. A1 customs value rose from $285.9 million in January–June 2025 to $315.0 million in January–June 2026, a calculated increase of 10.16%. A2 moved from $277.3 million to $263.8 million, a decrease of 4.87%. A3 moved from $54.4 million to $52.0 million, a decrease of 4.33%. The calculation uses the same six-month window on each side and validated code continuity. It is therefore suitable for describing direction within each classification, but it is not a full-year forecast. [1]
Why does that distinction matter to a buyer? A broad story about “paper packaging imports” could obscure a positive movement in one disclosed category and negative movement in another. It could also direct procurement attention toward the wrong part of the supply base. A folding-carton buyer needs evidence that fits folding cartons; a corrugated shipper needs evidence that fits corrugated structures. Even then, customs data do not reveal dimensions, flute, board grade, print, end use, custom status, order size or customer segment. They show border value by classification and time—nothing more.
A4 illustrates the same discipline. The paper sack and bag context is a disclosed sum of HTS 4819300040 and 4819400040, which recorded $921.345 million in 2025 customs value. The basket is useful only when both codes and their exclusions are stated. It is not a retail paper-bag market, branded-bag demand or a proxy for custom shopping bags. Because its product boundary differs from A1–A3, it is not treated as a fourth directly comparable box category.
The evidence does not explain why any series changed. Customs data alone cannot allocate a movement among prices, weight, product mix, exchange rates, sourcing shifts or buyer behavior. It cannot show that imported supply gained or lost competitiveness. The defensible conclusion is narrower: in the measured periods, the disclosed classifications moved differently. That finding is strong enough to reject a one-size-fits-all sourcing headline, but not strong enough to choose a country, supplier or material system.
03 — Where U.S. Paper Packaging Imports Come From
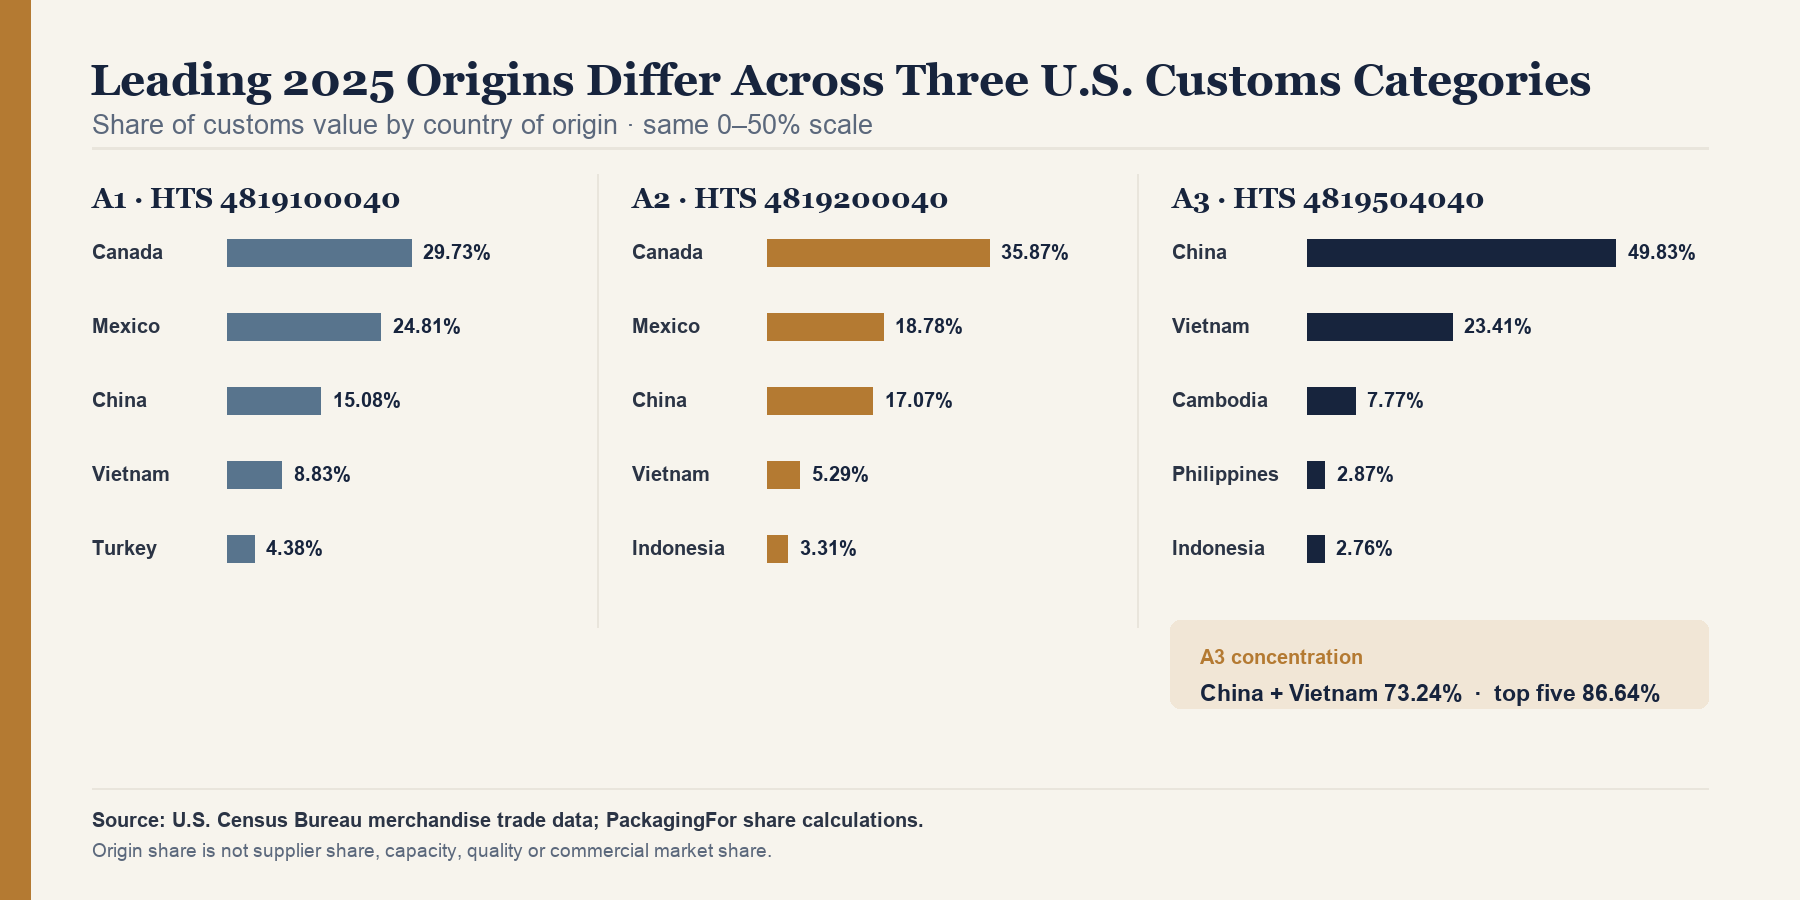
Country-of-origin data add a second dimension to customs value, but they require equally careful interpretation. For A1 in 2025, Canada accounted for 29.73% of U.S. customs value, Mexico 24.81%, China 15.08%, Vietnam 8.83% and Turkey 4.38%. The pattern shows a substantial North American component alongside Asian and other origins. It does not reveal how many suppliers operated in each country, how much capacity was available, whether a package met performance requirements or what landed economics a buyer could obtain.
A2 had a different origin mix. Canada represented 35.87%, Mexico 18.78%, China 17.07%, Vietnam 5.29% and Indonesia 3.31%. North American origins remained important, but the distribution was not the same as A1. The difference is relevant when a buyer considers redundancy, transit pathways, customs administration or regional supplier discovery. It is not proof that one classification is inherently more resilient or that any named origin is better on quality, service or compliance.
A3 was much more concentrated by customs value. China accounted for 49.83% and Vietnam 23.41%; their combined share was 73.24%. Cambodia, the Philippines and Indonesia followed with 7.77%, 2.87% and 2.76%, bringing the five largest origins to 86.64%. This is a reproducible concentration observation within HTS 4819504040. It should be described as U.S. imports classified as rigid boxes and cartons, not as custom, luxury or premium gift-box market share. [2]
Origin concentration can shape the questions a buyer asks. A highly concentrated customs category may justify checking country alternatives, production continuity, transit routes, documentation handoffs and the consequences of changing structure or material. Yet the public data do not measure supplier-level concentration. Many suppliers could exist inside a high-share country, and a low-share country could have only a small number of relevant producers. Customs origin also does not establish fiber origin, chain of custody, converting location for every component or the location where printing, assembly and packing occurred.
The three origin profiles therefore answer a modest but useful question: where was customs value attributed within each disclosed category in 2025? They do not answer which origin a buyer should select. That second question requires a matched specification, supplier capabilities, samples or testing, commercial terms, logistics and current regulatory facts. The decision should be made category by category because the measured origin structures differ, while the buyer’s actual risk tolerance and service requirements remain transaction specific.
04 — Rigid Boxes Are a Distinct Sourcing Case
Rigid boxes deserve a separate analytical treatment because the available trade and domestic product evidence illuminate different layers. On the trade side, HTS 4819504040 measures U.S. imports classified as rigid boxes and cartons. It does not identify luxury presentation boxes, custom rigid boxes, premium gift packaging, printed status, end market or buyer type. On the domestic side, NAPCS 2047850000 measures “Manufacturing of setup paperboard boxes, packaging, and packaging components” in the 2022 Economic Census. The two categories are related to rigid or setup structures, but they are not a combined market and should never be added or compared as if their value concepts were the same.
Within the customs category, 2025 origin value was concentrated: China and Vietnam together represented 73.24%, and the five largest origins represented 86.64%. The transport profile also showed that vessel movements represented 89.40% of general-import customs value for the category, while air represented 7.33% and other modes 3.27%. Containerized vessel value accounted for 98.77% of vessel value. These mode shares characterize recorded flows; they do not reveal whether a particular buyer should ship by sea or air, and they do not measure delivery reliability.
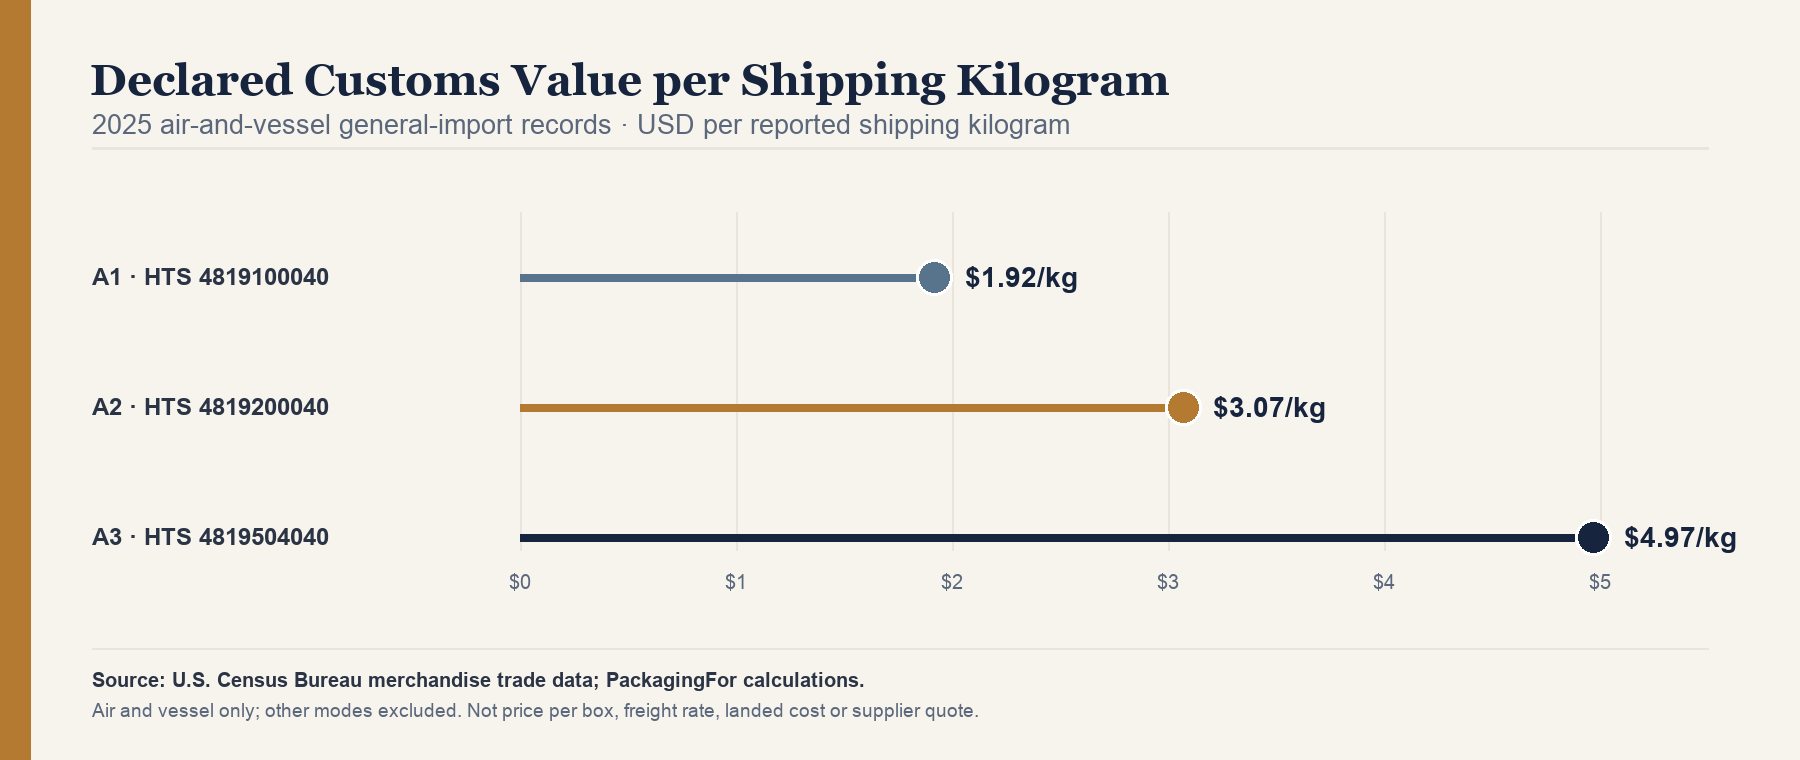
The validated 2025 air-plus-vessel general-import records reported approximately 26,962,879 kilograms of shipping weight and a declared customs value-to-weight ratio of $4.97 per kilogram. That ratio is calculated from the comparable value and weight fields for the included modes. It is not a unit price, selling price, freight rate or landed cost, because the data do not identify the number, size, construction or finish of boxes and exclude other transport records from the weight universe. [9]
The domestic NAPCS measure adds a different fact. In 2022, 127 establishments reported the setup-box product and the product sales, shipments or revenue measure was $769.845 million. “Reporting establishments” is the Census product-statistics concept; it is not a count of factories able to make custom rigid boxes, and the value is not demand or capacity. The public product definition also includes associated packaging components. [3]
For a buyer, the evidence suggests a structured investigation rather than a categorical conclusion. First confirm whether the proposed item is actually a setup or rigid structure and whether trade classification advice is needed. Then separate product engineering—board, wrap, insert, closure, finish and tolerances—from origin and logistics. Finally, request documents that correspond to any environmental or regulatory statements. The evidence does not show that imports are preferable, that domestic production is preferable, or that a concentrated origin pattern is necessarily unsafe. It shows that rigid or setup boxes have distinctive data signals and deserve their own specification and continuity plan.
05 — The U.S. Manufacturing Footprint
The Quarterly Census of Employment and Wages provides a national view of employment and establishments by industry. It is valuable because it is broad and consistently classified, but that breadth is also its limitation for custom packaging decisions. NAICS assigns an establishment according to its primary activity. It does not classify every production line inside the location, and it does not indicate whether the establishment accepts external custom orders, serves a particular end market or has available capacity.
PRELIMINARY 2025 annual-average employment was 103,594 in NAICS 322211, corrugated and solid fiber box manufacturing; 28,173 in NAICS 322212, folding paperboard box manufacturing; 25,433 in NAICS 322219, other paperboard container manufacturing; and 53,561 in NAICS 322220, paper bag and coated and treated paper manufacturing. These figures show that the labor footprints differed substantially under the exact industry definitions. They do not rank the industries by productivity, product value, technology, quality or commercial attractiveness. [4]
The corresponding PRELIMINARY establishment counts were 1,688, 406, 396 and 1,080. In QCEW, an establishment is an economic unit at a single physical location where business is conducted or services or industrial operations are performed. It is not necessarily a standalone factory, a supplier headquarters or an available converter. A multi-location company can have multiple establishments; a location can also make products beyond the commercial category a buyer has in mind. Describing these counts as “factories” would create false precision.
Geographic distributions provide context but not a ready-made supplier map. The leading published employment state differed across the four industries. Suppressed observations mean that a published ranking is not a complete census of every state value. It should therefore be used to identify areas for further supplier discovery, not to claim that one state has the most usable capacity. [4]
Wage data belong to the same contextual layer. Changes in annual pay can help a buyer understand that labor conditions vary over time and across industries, but they cannot isolate direct labor per box or predict a quote. QCEW pay measures include more than shop-floor conversion labor, while package economics depend on automation, run length, material yield, make-ready, print, finishing, packing and overhead. A rising or falling wage series would not, by itself, explain a supplier price.
The manufacturing footprint matters because it prevents the import record from being treated as the entire supply picture. It also prevents the opposite mistake: broad domestic employment does not prove that a particular structure can be sourced locally at the required scale, quality, timing or economics. A buyer can use NAICS data to understand industrial presence and candidate regions, then move to product-level classification, actual supplier qualification and transaction evidence. Public employment data are a map of economic activity, not a scorecard of suppliers. The 2025 values remain PRELIMINARY and should be refreshed when final QCEW data are released.
06 — Product-Level Data Matters
NAICS and NAPCS answer different manufacturing questions. NAICS asks what an establishment principally does. NAPCS asks what product is reported. The distinction matters when a broad industry contains multiple packaging structures or when a specific product is reported from more than one industry. A buyer evaluating folding cartons or setup boxes needs to know whether a statistic describes an industry’s total activity or the value of an exact product category.
The 2022 Economic Census reported $18.563 billion in product sales, shipments or revenue for NAPCS 2047825000, “Manufacturing of folding paperboard boxes, packaging, and packaging components,” across 1,018 reporting establishments. It reported $769.845 million for NAPCS 2047850000, “Manufacturing of setup paperboard boxes, packaging, and packaging components,” across 127 reporting establishments. The wording, reference year and reporting concept must remain adjacent to the values. These figures are not a current market size, total domestic demand, available capacity or sales of custom packaging alone. [3]
| Layer | System | Exact examples used | What it measures | Appropriate use | Do not infer |
|---|---|---|---|---|---|
| Trade | HTS10 | 4819100040; 4819200040; 4819504040 | U.S. merchandise trade under a customs classification | Customs value, origin and disclosed transport fields | Commercial-product demand, custom status, end use, unit sales or market size |
| Industry | NAICS | 322211; 322212; 322219; 322220 | Establishments grouped by primary industry | Employment, establishments and broad industry context | Exact product output, capacity, supplier capability or factory count |
| Product | NAPCS | 2047825000; 2047850000 | Products reported across establishments | Exact folding and setup paperboard-box product measures | Total addressable market, current demand or custom-only sales |
| Price | BLS PPI | Four exact packaging industry series and one industry-product subseries | Relative change in producer selling-price indexes | Matched-period direction by category | Price per box, cost cause, margin, quote or forecast |
The large difference between the two measures should not be converted into a claim about attractiveness or growth. It partly reflects the boundaries of the named product categories and the production captured in the Census reference year. A setup-box buyer cannot infer that only the reported establishments are capable suppliers, just as a folding-carton buyer cannot infer that the product value represents the revenue addressable by one vendor. Product statistics are strongest when used to distinguish categories and establish an official benchmark, not when used as a commercial forecast.
Corrugated product statistics add further evidence that end-use wording can exist below the broad industry layer. The source tables include named corrugated product lines rather than one universal corrugated package. That structure reinforces the report’s approach: use the most specific published definition that fits the question and state what remains outside it. The evidence does not identify custom status, print complexity, run length, board grade or customer industry unless the official product definition explicitly does so.
For procurement, the practical implication is to classify the proposed package before comparing suppliers or statistics. Begin with the physical structure, then map the relevant industry and product definitions without assuming equivalence. A classification crosswalk reduces the risk that trade, manufacturing and commercial terms are combined into a number that appears comprehensive but measures no coherent universe. Product-level evidence improves precision; it does not eliminate the need for a quote-ready specification.
07 — Packaging Price Signals Diverged in 2026
Producer price indexes measure average changes over time in selling prices received by domestic producers for their output. They are useful direction indicators because the series are consistently defined and can be compared over matched periods. They do not show a representative invoice, unit price, cost stack, discount, margin or future quote. That boundary is essential for packaging, where dimensions, material, print, finish and run length can change unit economics even within one product family.
For January–July 2026 compared with January–July 2025, the average PPI movement was +3.91% for corrugated and solid fiber box manufacturing, −4.01% for folding paperboard box manufacturing, +5.61% for other paperboard container manufacturing, +6.22% for paper bag and coated and treated paper manufacturing, and +6.86% for the setup (rigid) paperboard boxes subseries. Recent PPI observations are preliminary or revisable. The comparison uses the same seven months in both years to avoid treating a partial-year average as if it were a full-year change. [5]
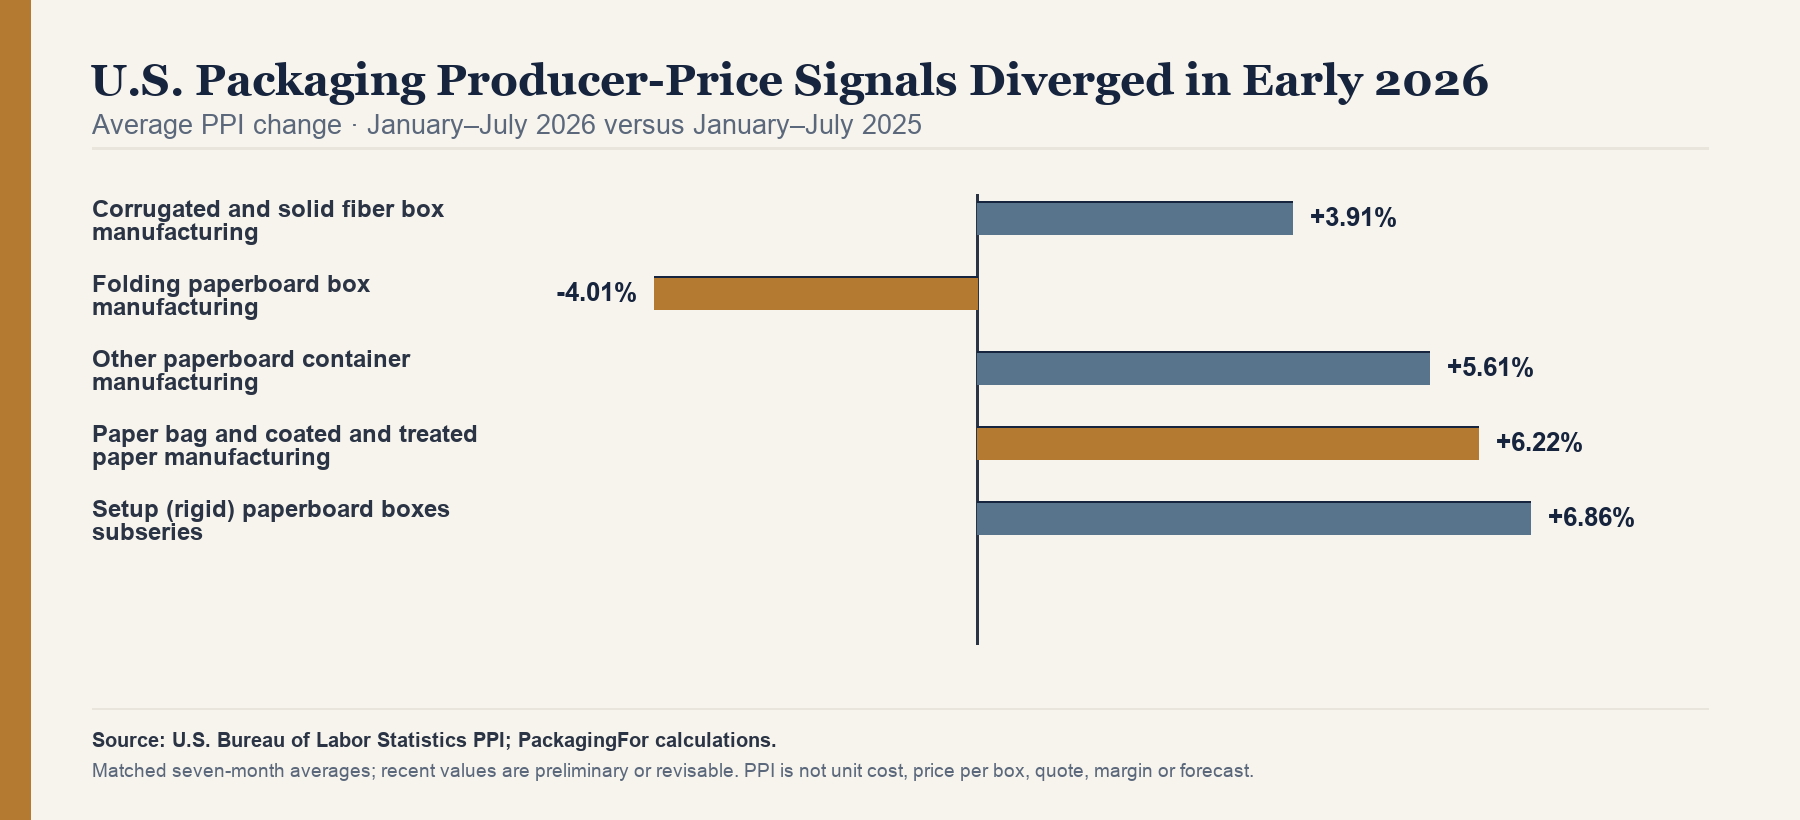
The direction and magnitude differ enough to reject a single “packaging prices” headline. Folding paperboard boxes moved in the opposite direction from the other four published series in this matched window. Setup paperboard boxes recorded the largest positive change among the five. Yet the indexes cannot explain causation. This evidence does not allocate movement among fiber, energy, labor, utilization, product mix or contract timing, and it does not show that every supplier changed prices by the index rate.
PPI also cannot be transferred across categories. A buyer of a folding carton should not use the corrugated and solid fiber box manufacturing series as a substitute merely because both are paper packaging. A rigid or setup-box project should not assume that the setup-box index covers every imported rigid structure or finishing system. The official definitions establish the scope; the buyer’s package specification determines whether the series is even a useful context indicator.
The appropriate buying use is disciplined, not mechanical. PPI can inform questions during quote review: Is a supplier’s claimed market movement directionally consistent with the relevant series? Is the comparison window matched? Does the quote change reflect the same structure and specification? It cannot calculate the “correct” price. A buyer still needs comparable supplier quotes and a cost model that accounts for transaction-specific inputs.
What the evidence shows is category divergence during a defined period. What it does not show is a forecast or an explanation. That distinction protects both parties: the buyer avoids treating an index as an entitlement to a discount, while the supplier cannot present a broad headline as proof of a project-specific increase. The index is a reference point; the specification and commercial record govern the actual comparison.
08 — Unit Price Is Not the Whole Sourcing Economics
A defensible sourcing comparison begins by separating public indicators from transaction costs. The validated 2025 air-plus-vessel general-import records produced declared customs value-to-weight ratios of about $1.92 per kilogram for A1, $3.07 for A2 and $4.97 for A3. These ratios differ, but they combine unknown product mixes within each customs category. They do not reveal price per box because the denominator is shipping weight, not units, and the data do not disclose the dimensions, material system, print, finish or order quantity behind each entry. [9]
For A3, the validated air-plus-vessel general-import charge field was approximately $0.55 per reported shipping kilogram in 2025. Consumption import charges were 10.85% of consumption customs value under the Census definition. Neither measure is a universal freight or duty percentage. The import-charge field does not equal total logistics cost; customs value does not include every landed-cost component; and the ratio does not identify inland transport, brokerage, duty, insurance, storage or the consequences of inventory timing.
Supplier quotes add another layer. To compare them, the buyer must hold the specification constant: internal dimensions and tolerances, structure, substrate, caliper or flute, print process and coverage, coating or lamination, finishes, inserts, closure, testing, pack-out, quantity and delivery schedule. Tooling, plates, sampling, assembly, master-carton configuration and palletization may be quoted separately or embedded. Commercial terms determine when ownership, risk and transport costs change hands. A low visible unit number can therefore coexist with a higher total delivered cost or greater inventory exposure.
Operational consequences belong in the model as explicit assumptions rather than invented public benchmarks. Lead-time variability can affect safety stock; inconsistent packing can change damage or handling; rework can consume labor; and dimensional variation can disrupt automated packing. This report does not quantify those buyer-specific effects. It recommends that they be identified, measured internally where possible and compared under consistent scenarios.
The evidence does not support a universal domestic-versus-imported landed-cost ranking. PPI measures domestic producer-price movement, while customs value per kilogram describes declared import value relative to reported weight for selected modes. Combining them into a “savings” calculation would mix different concepts. A credible comparison requires actual unit quotes plus known duties, freight, insurance, brokerage, inland transport, tooling, packing, inventory, quality and service assumptions.
That boundary is useful rather than limiting. It tells buyers where public evidence ends and where their own sourcing model must begin. Public data can frame direction, category mix and logistics questions. Only a matched specification and transaction evidence can establish the economics of a particular package.
09 — Recycling Numbers Need a Denominator
“Recyclable” and “recycled” describe different propositions. Technical recyclability concerns whether a material can be processed under specified conditions. Access concerns whether collection or drop-off is available to consumers. Acceptance concerns what local programs permit. Collection or recovery concerns material entering a system. Actual recycling concerns processing into a form used to make products. A recycling rate expresses a numerator divided by a denominator under a defined method. Mill use concerns recovered fiber consumed by mills. A defensible statement identifies which proposition is being measured rather than treating the words as synonyms.
Two widely cited U.S. sources illustrate why methodology belongs beside the number. EPA’s material-flow estimate for 2018 reported a 96.5% recycling rate for corrugated boxes. The American Forest & Paper Association reported ranges for 2024: 60%–64% for paper and 69%–74% for cardboard. The sources use different reference years, material boundaries, datasets and denominators. They should not be averaged, merged into a synthetic national rate or presented as a time series. The EPA number is not a current 2026 rate; the AF&PA ranges are industry estimates with their own methodology. [10]
| Publisher | Reference period | Material scope | Display value | Method boundary |
|---|---|---|---|---|
| U.S. EPA | 2018 | Corrugated boxes in EPA material-flow framework | 96.5% | Federal estimate; not current and not package-specific |
| AF&PA | 2024 | Paper | 60%–64% | Industry estimate; different source, scope and denominator |
| AF&PA | 2024 | Cardboard | 69%–74% | Do not merge with paper or EPA into a trend |
The reported figures also do not establish what happens to a particular finished package. A box can include coatings, films, windows, foils, adhesives, inks, labels, inserts or closures that affect sortation or processing. Product contamination and local program rules can affect acceptance. A high category-level rate therefore does not automatically substantiate an unqualified recyclable claim for every configuration. Conversely, the absence of a universal rate does not prove that a package is unrecyclable. The package and the claimed disposal pathway must be assessed on their own evidence.
For buyers, the critical practice is to preserve the denominator and evidence chain. A supplier statement such as “paper based” is a material description, not proof of collection access or actual recycling. A mill-compatibility test can address a technical question but not nationwide access. A local acceptance list can address a jurisdiction but not actual processing. Chain-of-custody documentation can address sourcing but not recyclability. These pieces may be valuable, but they answer different questions.
A procurement file should therefore record the exact construction, component separability, material composition, test method where relevant, geographic scope of the claim, and the source and date for any access or recycling statistic. If a percentage is used, the file should capture its numerator, denominator and method. Marketing language should be no broader than the support. The goal is not to find one impressive number; it is to connect the intended claim to evidence that measures the same thing.
The evidence shows that U.S. paper and cardboard recycling statistics can be substantial within their own methods. It does not show a universal recycling rate for paper packaging, a trend between the EPA and AF&PA observations, or automatic recyclability for any specific design. That methodological restraint makes the information more useful: it helps a buyer ask what is measured, for which material, in which year, by whom, and for what decision.
10 — “Sustainable” Is Not a Material Specification
“Sustainable” is too broad to function as a production specification. It does not tell a converter which fiber, caliper, coating, adhesive, ink, finish, closure or performance level to provide. It also does not identify the environmental attribute being claimed. The Federal Trade Commission’s Green Guides distinguish broad, unqualified environmental-benefit claims from more specific claims such as recyclable and recycled content. Precise, qualified and documented wording is more supportable than a blanket label, but every claim still depends on the actual package and context. [11]
Several evidence families must remain separate. A recyclable claim concerns whether the item can be collected, separated or otherwise recovered through an established program for reuse or use in manufacturing or assembling another item, subject to applicable qualifications. A recycled-content claim concerns material recovered or diverted from the solid-waste stream and incorporated into the product, with the claimed amount substantiated. A compostable claim requires evidence tied to the conditions and time in which the item will break down. A responsible-fiber or chain-of-custody statement concerns sourcing records. Forest certification may support sourcing claims, but it does not by itself prove that the finished package is recyclable in a consumer’s program.
The same boundary applies to visual and implied claims. Leaf motifs, green color, certification-like seals or broad copy can convey an environmental benefit even if no numerical statement appears. The evidence file should address the net impression of the claim, not only one sentence. Qualifications should be clear, prominent and close enough to the claim to be understood. A qualification cannot rescue a representation if the headline remains materially misleading.
For procurement, this means translating a marketing objective into a testable specification. If the desired statement concerns recycled content, specify the material component, percentage basis, documentation and chain of custody. If it concerns recyclability, identify the construction and geographic qualification and request relevant testing or program evidence. If it concerns fiber sourcing, identify the certification system, scope and valid documentation. Do not ask a supplier merely to make the package “eco-friendly.”
This report does not approve any environmental claim and does not provide legal advice. It shows why substantiation must match the claim and why one evidence type cannot be substituted for another. A carefully documented specific statement can be reviewed; an undefined promise cannot be engineered or audited.
11 — U.S. Packaging EPR Is Not One National Rule
Packaging extended producer responsibility in the United States is a state-by-state legal and implementation landscape. California, Oregon, Maine, Colorado and Minnesota use distinct statutory frameworks, defined roles, covered-material concepts, exemptions, timelines and administrative processes. The evidence available through August 21, 2026 does not support describing them as one national U.S. EPR rule. A company’s obligations can depend on where a packaged product is sold or distributed and on who the law assigns as the producer. [6]
California’s implementing regulations became effective May 1, 2026, but implementation must still be read with the statute, regulations and current agency materials. A producer responsibility organization submitted a plan on June 15, 2026; submission is not the same as approval. Oregon’s program launched on July 1, 2025 under its own framework. Maine was not fully operational at the evidence cutoff, and its official materials continued to report implementation developments. Colorado provides a useful comparator but has different terminology and schedules. Minnesota remained in rule development. These snapshots are time-sensitive and should be checked again before a decision is made.
| State | Status at August 21, 2026 | Producer / buyer question | Required caution |
|---|---|---|---|
| California | Permanent regulations effective; submitted PRO plan remained in agency process | Who is the covered producer and which packaging is in scope? | Plan submission is not approval; verify current status |
| Oregon | Producer-responsibility program changes operational from July 1, 2025 | Does the company have participation, reporting or fee duties? | Oregon rules and exemptions are not transferable |
| Maine | Rules existed; program not fully operational at cutoff | What is the current contracting and implementation status? | Refresh after cutoff; projected timing is not binding |
| Colorado | Designated program implementation active under a distinct schedule | Which statutory role and sale restrictions apply? | Use Colorado-specific definitions and milestones |
| Minnesota | Statutory program existed; detailed implementing rules in development | What can be determined now and what awaits rules? | Screening status only; verify later rulemaking |
The party that buys packaging is not automatically the party legally defined as the producer in every state. The producer test may turn on brand ownership, licensing, importation, first distribution or other statutory facts. Packaging components and materials may also be treated differently. Exemptions, de minimis thresholds, covered-product boundaries and producer responsibility organization requirements are jurisdiction specific. A supplier can provide useful product and material information, but it cannot determine the buyer’s legal role without the buyer’s market and corporate facts.
This division of responsibility has practical consequences. The buyer or brand should identify destination states and determine its role with appropriate legal or compliance support. The supplier should maintain accurate package specifications, material weights and composition data that can support the buyer’s analysis. Both should control document versions, because an approved structure or material change can alter the underlying information. A generic statement that a package is “EPR compliant” is not a substitute for this process.
The state matrix in this report is a status orientation, not a compliance checklist. It does not calculate fees, assign producer status, determine exemptions or conclude whether a package is covered. It also does not establish that compliance in one state satisfies another. Those conclusions require current law, implementing rules, agency guidance and the facts of the company and transaction.
What the evidence shows is fragmentation: different states are at different stages and use different scope and role tests. What it does not show is one national standard or a transferable compliance badge. For packaging buyers, the most reliable control is to connect market placement to a jurisdiction-specific review and to retain the product data needed for that review.
12 — PPWR Changes the Documentation Question
Regulation (EU) 2025/40 entered into force on February 11, 2025 and generally applies from August 12, 2026. These two milestones are useful orientation points, but they do not make every obligation applicable on the same day. The regulation includes article-specific provisions, transitional arrangements and later staged dates. Any operational conclusion must identify the relevant article, packaging material, economic operator and date. This section is general information, not legal advice. [7]
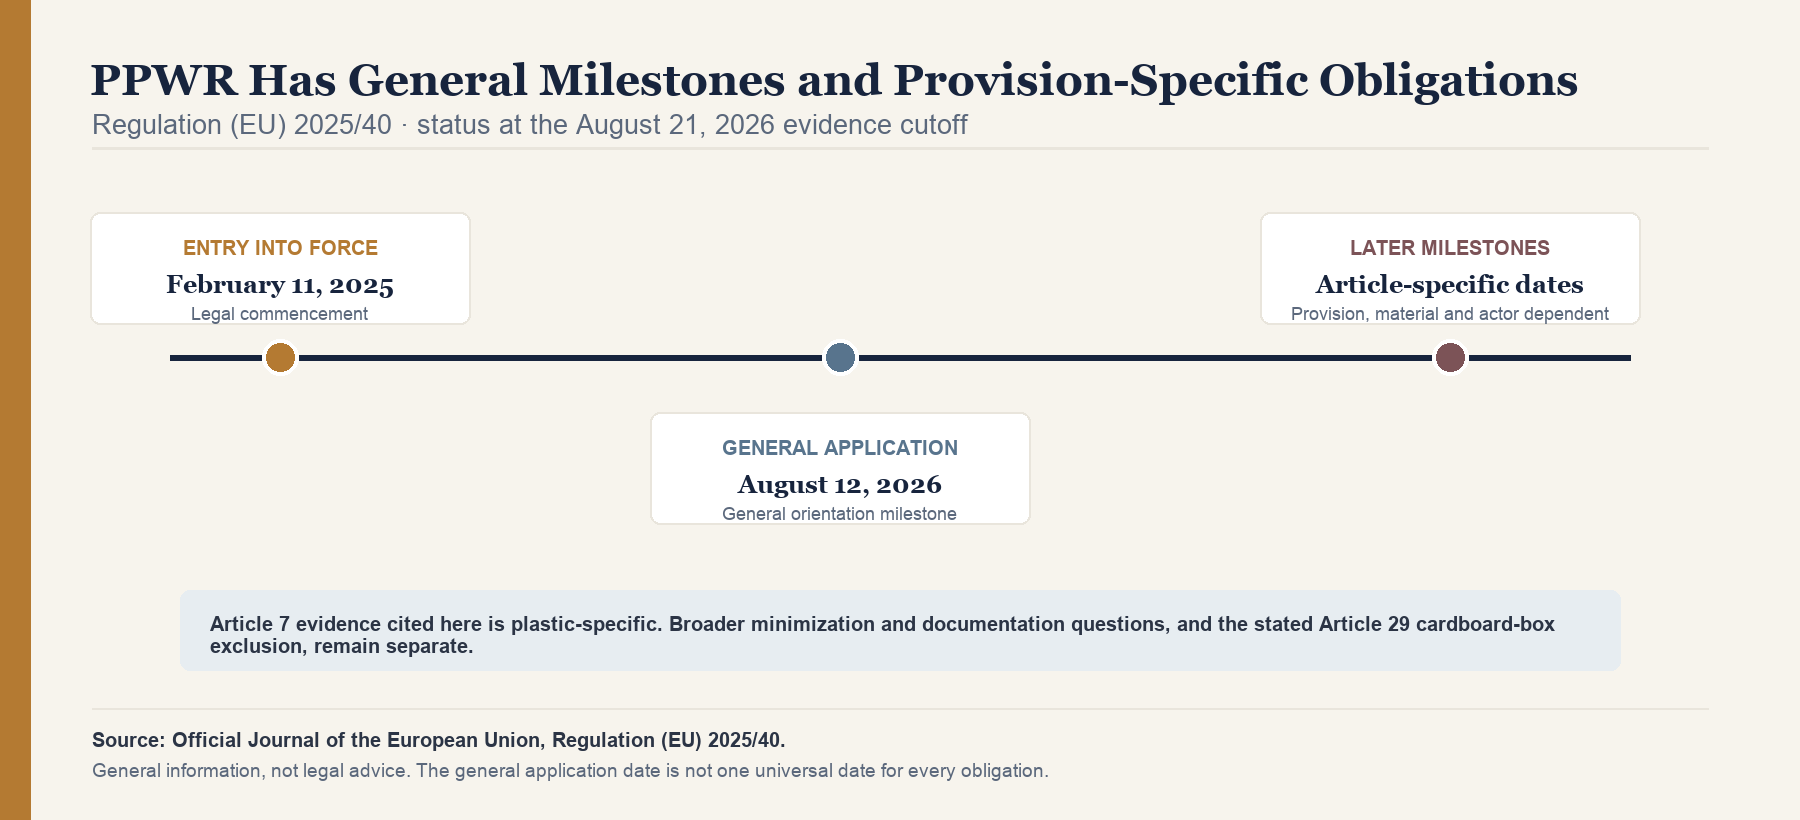
The material distinction is especially important for paper packaging. The Article 7 recycled-content provisions cited in this evidence base concern plastic packaging. They should not be rewritten as a recycled-content mandate for paper. Other provisions, including packaging minimization and related technical documentation, can reach broader packaging. The reuse provision in Article 29 also contains an exclusion for cardboard boxes under stated conditions. Removing that exclusion from a summary would overstate the paper-packaging requirement. [12]
The regulation changes the documentation question because a broad material label is not enough. A buyer placing packaged goods on the EU market may need to identify the package and components, material composition, weight and design choices, applicable conformity or technical-documentation requirements, and the role of each operator in the supply chain. The exact record depends on the provision and facts. A supplier’s role is to provide accurate, controlled product information and agreed evidence; the buyer or responsible economic operator must determine how the regulation applies to its market placement and claims.
Minimization is not the same as choosing the lightest possible package. The analysis must consider the regulation’s applicable requirements together with product protection, safety, transport and functionality. A change that reduces material but increases damage could shift impacts elsewhere and fail commercial requirements. This report does not calculate minimum weight, empty space or conformity for a specific design. It identifies the need to preserve the design rationale, test basis and version history.
The same caution applies to claims about compliance. “PPWR compliant” is too broad unless tied to the relevant actor, package, provision and date. The general application milestone cannot serve as a universal certification. Later delegated or implementing acts and updates may change the operational detail. Buyers should verify current official text and obtain legal advice where needed.
The evidence shows that PPWR creates a more structured, provision-specific documentation environment and that some requirements are material specific. It does not show that every paper package faces the same obligation, that Article 7 imposes a paper recycled-content requirement, or that every provision began on August 12, 2026. A defensible approach maps each package and operator to the applicable provision and retains the records that support the resulting decision.
13 — What a Quote-Ready Packaging Spec Should Contain
A quote becomes comparable only when suppliers are solving the same problem. The evidence in this report cannot prescribe one universal specification, because structure, product protection, claims and destination rules vary. It can support a four-tier documentation framework: CORE, PRODUCT-DEPENDENT, CLAIM-DEPENDENT and MARKET-DEPENDENT. The tiers are a procurement control, not a legal safe harbor or a requirement that every project collect every possible field.
CORE: define the package and transaction
The core record should identify the product being packed, intended use, packaging structure, internal dimensions and tolerance convention, quantity or quantity breaks, delivery destination and required delivery window. It should specify substrate or performance basis, print process and coverage, colors, coating or lamination, finishes, closure, assembly state and pack-out. Artwork responsibility, proofing, sampling, testing, change approval and version control should be assigned. Commercial fields should distinguish recurring unit cost from tooling, plates, sampling, packing, freight, duty and other one-time or variable charges.
These fields matter because public classifications omit most of them. Two entries in the same HTS or NAPCS category can have very different constructions and economics. Without a controlled core specification, a lower quote may simply exclude a finish, use a different board basis, assume a larger quantity, ship in a different state or transfer logistics obligations at a different point. The framework does not guarantee comparable supplier performance; it makes discrepancies visible before selection.
PRODUCT-DEPENDENT: add what performance requires
Product-dependent fields should be selected according to the packed product and distribution environment. They can include product weight and geometry, fragility, orientation, moisture or grease exposure, food-contact or cosmetic-contact conditions, compression and stacking needs, drop or vibration requirements, shelf presentation, opening sequence, tamper evidence, child resistance, electronics protection, insert retention, barcode readability and automated packing constraints. A folding carton, corrugated shipper, setup box and paper bag will not share the same complete test plan.
The buyer should define performance outcomes and test methods where they are known, then ask the supplier to identify assumptions. A substrate name alone does not specify finished-package performance. Likewise, a passing material certificate may not establish performance after printing, coating, converting, assembly and distribution. Product-dependent evidence should be linked to the approved construction and revision.
CLAIM-DEPENDENT: match evidence to the exact statement
Claim-dependent fields begin with the words the buyer intends to use. A recycled-content statement needs the claimed component, percentage basis, source records and qualification. A recyclable statement needs the finished construction, separability assumptions, relevant test or program evidence and geographic scope. A compostable statement requires appropriate conditions, standards and certification evidence if claimed. A responsible-fiber or chain-of-custody statement needs valid certification records, scope and claim-control language. Broad environmental-benefit wording should not replace these specific propositions.
The file should also distinguish supplier declarations, third-party certificates, laboratory reports and public program information. Each has a different evidentiary role. A certificate should be checked for holder, scope, validity and relationship to the actual material. A test report should be checked for sample identity, method, date and result. Public recycling statistics should not be presented as proof about one package. Claim approval remains a buyer governance and legal-review decision.
MARKET-DEPENDENT: identify where and by whom the package is placed
Market-dependent fields connect the specification to legal geography and actor roles. The record should identify the countries and U.S. states where the packaged product will be sold or distributed, the brand owner or license relationships, importer or first-distributor roles where relevant, and any regulated product category. For EPR, the buyer must determine producer status and covered-material treatment under each applicable state framework. For PPWR, the responsible operator must map the package, material and activity to the relevant provisions and dates. The supplier can support this work with accurate material and component data, but cannot establish the buyer’s legal status in the abstract.
The completed evidence pack should be treated as a controlled record rather than a one-time questionnaire. A change in board, coating, adhesive, insert, supplier location, artwork or destination market can invalidate part of the prior analysis. Revision history, approval authority, effective date and superseded documents should be retained. The purpose is not paperwork for its own sake. It is to make quote comparison, quality review, environmental claims and jurisdictional analysis refer to the same approved package.
| Tier | Include when | Core fields / evidence examples | Does not guarantee |
|---|---|---|---|
| CORE | Every sourcing project | Product/use, structure, dimensions, material/performance basis, print/finish, quantity, destination, commercial terms, revision | Supplier performance, capacity or final landed cost |
| PRODUCT-DEPENDENT | Product and distribution conditions require it | Fragility, exposure, stacking, barrier, contact, automation, tests and approved samples | Universal test sufficiency for every route |
| CLAIM-DEPENDENT | An environmental or certification statement is intended | Exact claim, component, percentage basis, geography, supplier declarations, tests and certificates | Marketing approval, legal safe harbor or automatic recyclability |
| MARKET-DEPENDENT | Destination law or program may apply | Countries/states, brand and importer roles, applicable dates, registrations and controlled material data | Producer-status determination or compliance certification |
14 — Implications for Packaging Buyers
The evidence supports ten bounded considerations. They are inferences and recommendations, not statistical findings or guarantees.
- Classify before comparing. Define the physical structure and use the exact HTS, NAICS or NAPCS scope appropriate to the question. Do not substitute a commercial nickname for an official category.
- Keep category trends separate. A1, A2 and A3 moved in different directions in the first half of 2026, so a broad paper-packaging headline is an unreliable starting point.
- Treat origin concentration as a prompt, not a verdict. Country shares can guide continuity questions, but do not measure supplier count, quality or available capacity.
- Use domestic footprint data for orientation. PRELIMINARY employment and establishment data can identify industrial presence, but supplier capability and capacity require direct qualification.
- Interpret PPI as an index. Match the product series and comparison window, then return to actual quotes. Do not translate the index change into price per box.
- Build landed economics from transaction inputs. Customs value per kilogram and import charges can frame questions, but they cannot replace unit quantity, duty, freight, tooling, packing, inventory, quality and service inputs.
- Attach a denominator to recycling statistics. Record publisher, year, material scope and method. Do not convert unlike sources into one trend or a claim about every finished package.
- Convert sustainability language into evidence requests. Separate recyclability, recycled content, compostability and fiber sourcing; request support for the exact statement and package.
- Map regulation to destination and role. U.S. EPR frameworks differ by state, while PPWR duties differ by provision, material, actor and date. A generic supplier claim is insufficient.
- Control the evidence pack over time. Link specifications, materials, claims, tests, certificates and jurisdictional records to the approved revision. Reassess when the package or market changes.
No item on this list proves that imported or domestic supply is universally better, cheaper, faster or lower risk. The common logic is narrower: category-specific evidence and controlled transaction records produce a more auditable decision than a broad headline or label.
15 — Methodology
Scope and evidence cutoff
This whitepaper synthesizes the Phase 1–4 evidence system developed for PackagingFor. Its scope is U.S. paper-packaging sourcing context, with EU PPWR included because U.S. buyers and brands may place packaged goods on the EU market. The evidence cutoff is August 21, 2026. PackagingFor is the publisher, research sponsor and a packaging sourcing practitioner; it is not presented as an independent research institute. No new external dataset was introduced in this draft.
Source hierarchy
Primary official sources were preferred. U.S. trade observations come from the U.S. Census Bureau merchandise trade system and USA Trade Online references. Manufacturing product statistics come from the 2022 Economic Census. Employment and establishment observations come from BLS QCEW, and producer-price observations come from BLS PPI. EPA supplies a federal material-flow estimate; AF&PA supplies an industry methodology and range that are kept separate. Regulatory findings rely on official statutes, regulations, agency materials, FTC guidance and the official EU regulation. Industry material is used only with a visible publisher and method limitation.
The hierarchy is not a claim that every official series is suitable for every purpose. Official customs data can be numerically strong and still poorly matched to a commercial product label. Industry recycling estimates can be informative and still not be comparable with an EPA material-flow series. Legal text can establish a rule while leaving actor-specific application to a fact-based review.
Classification crosswalk
The study established four trade baskets. A1 is HTS 4819100040, other corrugated cartons, boxes and cases. A2 is HTS 4819200040, folding cartons, boxes and cases of noncorrugated paper or paperboard. A3 is HTS 4819504040, rigid boxes and cartons. A4 is the disclosed combination of HTS 4819300040 and 4819400040 for paper sacks and bags. Exact descriptions and exclusions were preserved. The trade baskets were not renamed as mailers, cosmetic boxes, luxury boxes, packaging inserts or custom products.
For domestic production, NAICS was used for industry employment, establishments and broad industry context. NAPCS was used for product measures. The crosswalk does not assert that a trade category, industry and product category are identical. It identifies where concepts are adjacent and where combination would be invalid.
Trade calculations
Full-year baselines cover 2021–2025. First-half change compares January–June 2026 with January–June 2025 under validated code continuity. Country shares use the 2025 world total for the same HTS classification. Concentration calculations use disclosed origin shares. Transport indicators use the fields and mode universe specified in the Evidence Ledger. Declared customs value per kilogram is value divided by reported shipping weight for comparable air-and-vessel records; other modes are excluded. Import-charge ratios use the Census field definition and are not treated as ocean freight or landed cost.
Manufacturing and producer-price treatment
The manufacturing analysis preserves source status and unit. QCEW 2025 annual averages are labeled PRELIMINARY. Establishments are reporting locations, not factory counts; employment is not capacity. Economic Census product measures retain exact NAPCS wording and the 2022 reference year. Sales, shipments or revenue are not called market size or demand.
PPI comparisons use the average of January–July 2026 against the same months of 2025 for each exact series. The calculation describes index movement, not a price level. Recent values may be revised. The analysis does not attribute causes or forecast future price.
Recycling and regulatory treatment
Recycling observations were recorded with publisher, year, material scope, numerator, denominator and method. EPA and AF&PA figures were not combined into a trend. Technical recyclability, access, acceptance, collection, actual recycling, rate and mill use were treated as different concepts.
Regulatory status was captured at the cutoff. U.S. EPR findings are jurisdiction specific. PPWR findings preserve general and provision-specific dates, actor and material boundaries, the plastic scope of the cited Article 7 evidence, and the stated cardboard exclusion in Article 29. FTC environmental-claim guidance is treated as general guidance. Nothing in the report is legal advice or a compliance determination.
Claim quality system
Each publication candidate was assigned a Claim ID, evidence mapping, grade, qualification and prohibited interpretation. A-grade claims have direct, high-quality support and a clear publication form. B-grade claims are publishable only with visible scope or status limitations. C-grade claims remain context and are not promoted to central findings. D-grade items are labeled inferences or recommendations derived from the evidence rather than measured facts.
The Evidence Ledger retains source, observation, metric, geography, period, extraction date, verification status and limitation. A Claim–Evidence Map records support and counterevidence. The Number Register records reader-visible quantitative values and rounding. The Draft Claim Audit checks citations, qualifications, preliminary labels, regulatory scope, unsupported inference and legal-advice risk.
Quarantine and counterevidence
Claims were quarantined when the evidence did not measure the proposed subject. Excluded affirmative claims include a custom-packaging market size; commercial-product import totals for mailer, cosmetic or luxury boxes; packaging-insert imports; domestic demand or capacity; factory counts; unit box prices; freight per box; a universal tariff; automatic sustainability or recyclability; treating FSC as recyclability evidence; and describing U.S. packaging EPR as one national rule. Counterevidence was retained where a statistic could be technically correct but commercially misread.
The method favors a narrower supported statement over a larger unsupported one. It does not remove uncertainty. Instead, it records which uncertainty belongs to classification, time, methodology, product design, commercial terms or legal scope so the buyer can request the appropriate next evidence.
16 — Limitations
This report is a synthesis of defined public evidence, not a census of the packaging industry or a supplier-selection model. Customs values measure imports within disclosed HTS classifications. They do not measure sales, consumption, units, domestic demand or total market size. The classifications do not isolate custom, printed, branded, ecommerce, cosmetic, luxury, premium, insert or mailer products unless the official description expressly does so. Country shares measure customs value by origin, not supplier concentration, fiber origin, quality or capacity.
Trade value-to-weight and import-charge indicators use specified Census fields and transport universes. They are not price per box, average selling price, freight per box, duty rate, supplier quote or landed cost. Air-and-vessel calculations exclude other modes. PPI measures producer-price index movement and can be revised; it is not a price level, cost explanation or forecast.
QCEW 2025 observations are PRELIMINARY. Employment is not capacity, and establishments are not factories or available suppliers. Economic Census product values refer to 2022 exact NAPCS categories and reporting establishments. They are not current market size, demand, capacity or custom-only sales. NAICS industry measures and NAPCS product measures are not interchangeable.
Recycling statistics depend on year, scope and denominator. EPA 2018 and AF&PA 2024 values are not a continuous series and do not establish the performance of a specific package. Paper content, certification or chain-of-custody evidence does not automatically establish recyclability, collection access or actual recycling. Environmental claims require product- and context-specific substantiation.
Regulatory summaries reflect sources available through August 21, 2026 and may change. U.S. packaging EPR is state specific; PPWR obligations are provision-, material-, actor- and date-specific. The report does not assign producer status, calculate fees, determine exemptions, certify compliance or replace legal advice. Buyers should verify current official sources and obtain professional advice for their facts.
The report does not establish that imported or domestic supply is universally better, cheaper, faster, more sustainable or lower risk. It offers an evidence structure for asking better questions. Final sourcing decisions still require a controlled specification, qualified suppliers, samples or tests, current quotes, logistics and quality assumptions, documented claims, applicable legal review and commercial judgment.
Endnotes
- U.S. Census Bureau, Merchandise Trade Imports / USA Trade Online, HTS 4819100040, 4819200040 and 4819504040; January–June 2026 compared with January–June 2025; customs value, imports for consumption. Calculations: +10.16%, −4.87% and −4.33%. https://www.census.gov/foreign-trade/data/IMDB.html.
- U.S. Census Bureau, Merchandise Trade Imports / USA Trade Online, HTS 4819504040, country-of-origin customs value, 2025. China 49.83%, Vietnam 23.41%, combined 73.24%, top five 86.64%. https://www.census.gov/foreign-trade/data/IMDB.html.
- U.S. Census Bureau, 2022 Economic Census: Products by Industry, NAPCS 2047825000 and 2047850000, product sales, shipments or revenue and reporting-establishment observations. https://www.census.gov/data/tables/2022/econ/economic-census/naics-sector-00.html.
- U.S. Bureau of Labor Statistics, Quarterly Census of Employment and Wages annual averages, PRELIMINARY 2025 national employment and establishment data for NAICS 322211, 322212, 322219 and 322220. https://www.bls.gov/cew/downloadable-data-files.htm.
- U.S. Bureau of Labor Statistics, Producer Price Indexes — July 2026, matched January–July 2026 versus January–July 2025 averages for series PCU322211322211 (corrugated and solid fiber box manufacturing), PCU322212322212 (folding paperboard box manufacturing), PCU322219322219 (other paperboard container manufacturing), PCU322220322220 (paper bag and coated and treated paper manufacturing), and PCU3222193222191 (setup (rigid) paperboard boxes subseries). Recent observations are preliminary or revisable. https://www.bls.gov/ppi/detailed-report/ppi-detailed-report-july-2026.pdf.
- Official state materials used for the status matrix: CalRecycle, SB 54 Producer Guidance, https://calrecycle.ca.gov/packaging/packaging-epr/producerguidance/; Oregon Department of Environmental Quality, Producer Obligations Summary, https://www.oregon.gov/deq/recycling/Documents/RMAProducerObligationsSummary.pdf; Maine Department of Environmental Protection, Stewardship Program for Packaging, https://www.maine.gov/dep/waste/recycle/epr.html; Colorado General Assembly, HB22-1355, https://www.leg.colorado.gov/bills/hb22-1355; Minnesota Pollution Control Agency, Packaging Waste and Cost Reduction Act, https://www.pca.state.mn.us/get-engaged/packaging-waste-and-cost-reduction-act. Status at August 21, 2026; verify current law, rules, guidance and company facts.
- European Union, Regulation (EU) 2025/40 on packaging and packaging waste, Official Journal text and Article 71 chronology. Entered into force February 11, 2025; generally applies August 12, 2026, subject to provision-specific and staged dates. https://eur-lex.europa.eu/eli/reg/2025/40/oj/eng.
- U.S. Census Bureau, Merchandise Trade Imports / USA Trade Online, annual 2021–2025 imports for consumption and 2025 customs values for HTS 4819100040, 4819200040 and 4819504040. https://www.census.gov/foreign-trade/data/IMDB.html.
- U.S. Census Bureau, Merchandise Trade Imports / USA Trade Online, 2025 air-and-vessel general-import value and shipping-weight fields. Calculated customs value per reported shipping kilogram: A1 $1.92, A2 $3.07, A3 $4.97. A3 mode, weight and import-charge indicators use the field universes specified in the Evidence Ledger. https://www.census.gov/foreign-trade/data/IMDB.html.
- U.S. Environmental Protection Agency, 2018 Facts and Figures Tables, corrugated-box material-flow estimate, https://www.epa.gov/sites/default/files/2021-01/documents/2018_tables_and_figures_dec_2020_fnl_508.pdf; American Forest & Paper Association, 2024 U.S. Paper Recycling Rates, https://www.afandpa.org/news/2025/paper-industry-announces-2024-us-paper-recycling-rates. Different publishers, years, scopes and denominators; not a continuous series.
- U.S. Federal Trade Commission, Green Guides, 16 CFR Part 260, current guidance at the evidence cutoff, including general environmental-benefit, recyclable and recycled-content claims. https://www.ftc.gov/legal-library/browse/rules/green-guides. Forest Stewardship Council, Chain of Custody Certification, certification scope and claim controls, https://fsc.org/en/chain-of-custody-certification. Certification does not itself establish recyclability.
- European Union, Regulation (EU) 2025/40, Articles 7, 10, 15 and 29 as captured in the evidence base. Article 7 evidence cited here concerns plastic packaging; broader minimization and documentation provisions and the stated cardboard-box exclusion in Article 29 must be read separately. https://eur-lex.europa.eu/eli/reg/2025/40/oj/eng.
Dataset and Status Notes
- Trade: U.S. Census Bureau merchandise-trade observations and reproducible calculations. Full-year baseline 2021–2025; partial-year comparison January–June 2026 versus the same 2025 months.
- Manufacturing: 2022 Economic Census product statistics; BLS QCEW 2025 annual averages marked PRELIMINARY.
- Prices: BLS PPI matched January–July averages; recent observations may be revised.
- Recycling: EPA 2018 federal material-flow estimate and AF&PA 2024 industry methodology retained as non-comparable series.
- Regulation: official U.S. federal, state and EU sources; legal status captured at the evidence cutoff and subject to change. General information only, not legal advice.